Multivariable Functions
Instead of only concerning ourselves with
Planes are a form of multivariable function, where we have a plane
Sketching and Visualizing Multivariable Functions
We visualize multivariable functions of
I.e set x = 0, and draw on the yz plane, set y = 0, draw on the x-z plane, set z = some constant k, draw contours (aka a level curve)
What does it look like?
For side view 1, set
For side view 2, set
For the top view, we set
With this information, we can see that the function takes the shape of a cone
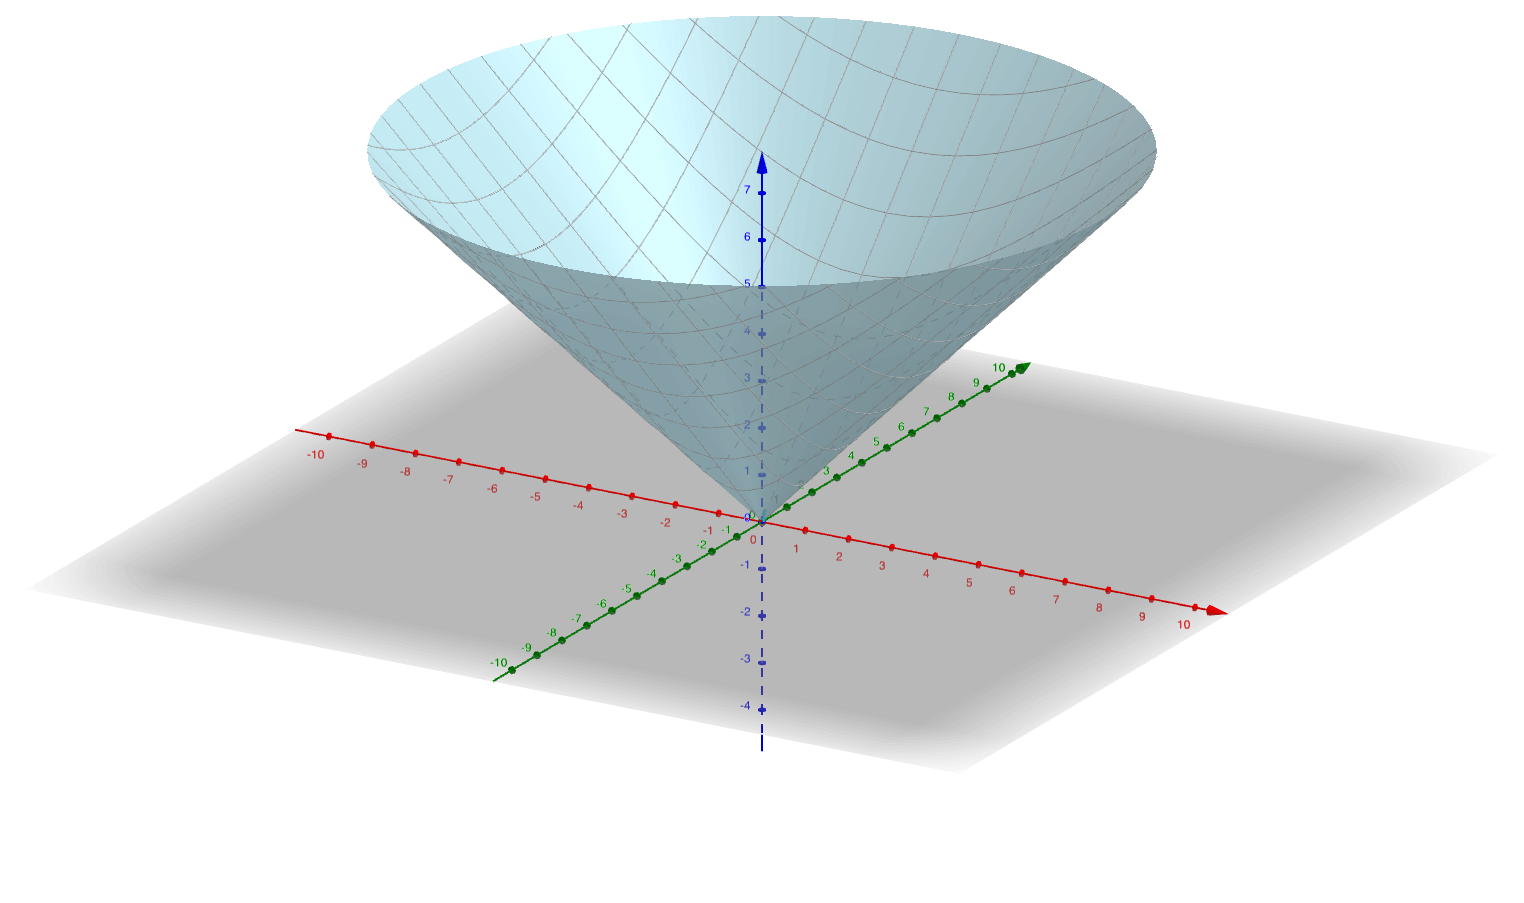
- Domain:
- Range:
When we set
But our level curve looks different
Which ends up looking like
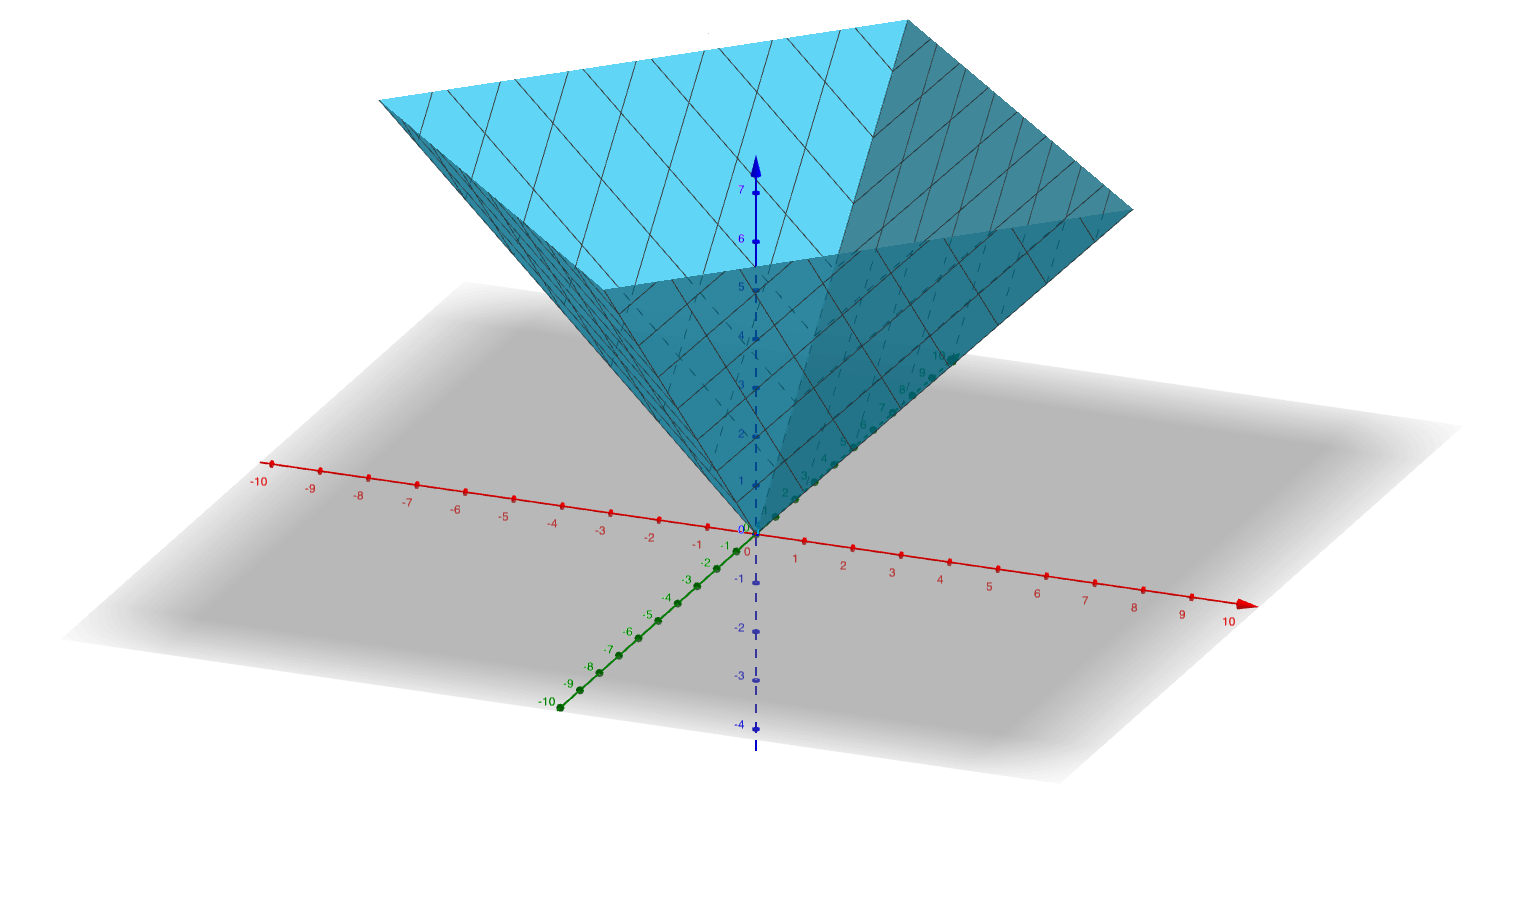
What is the domain?
This forms a circle with radius 1
What is the range?
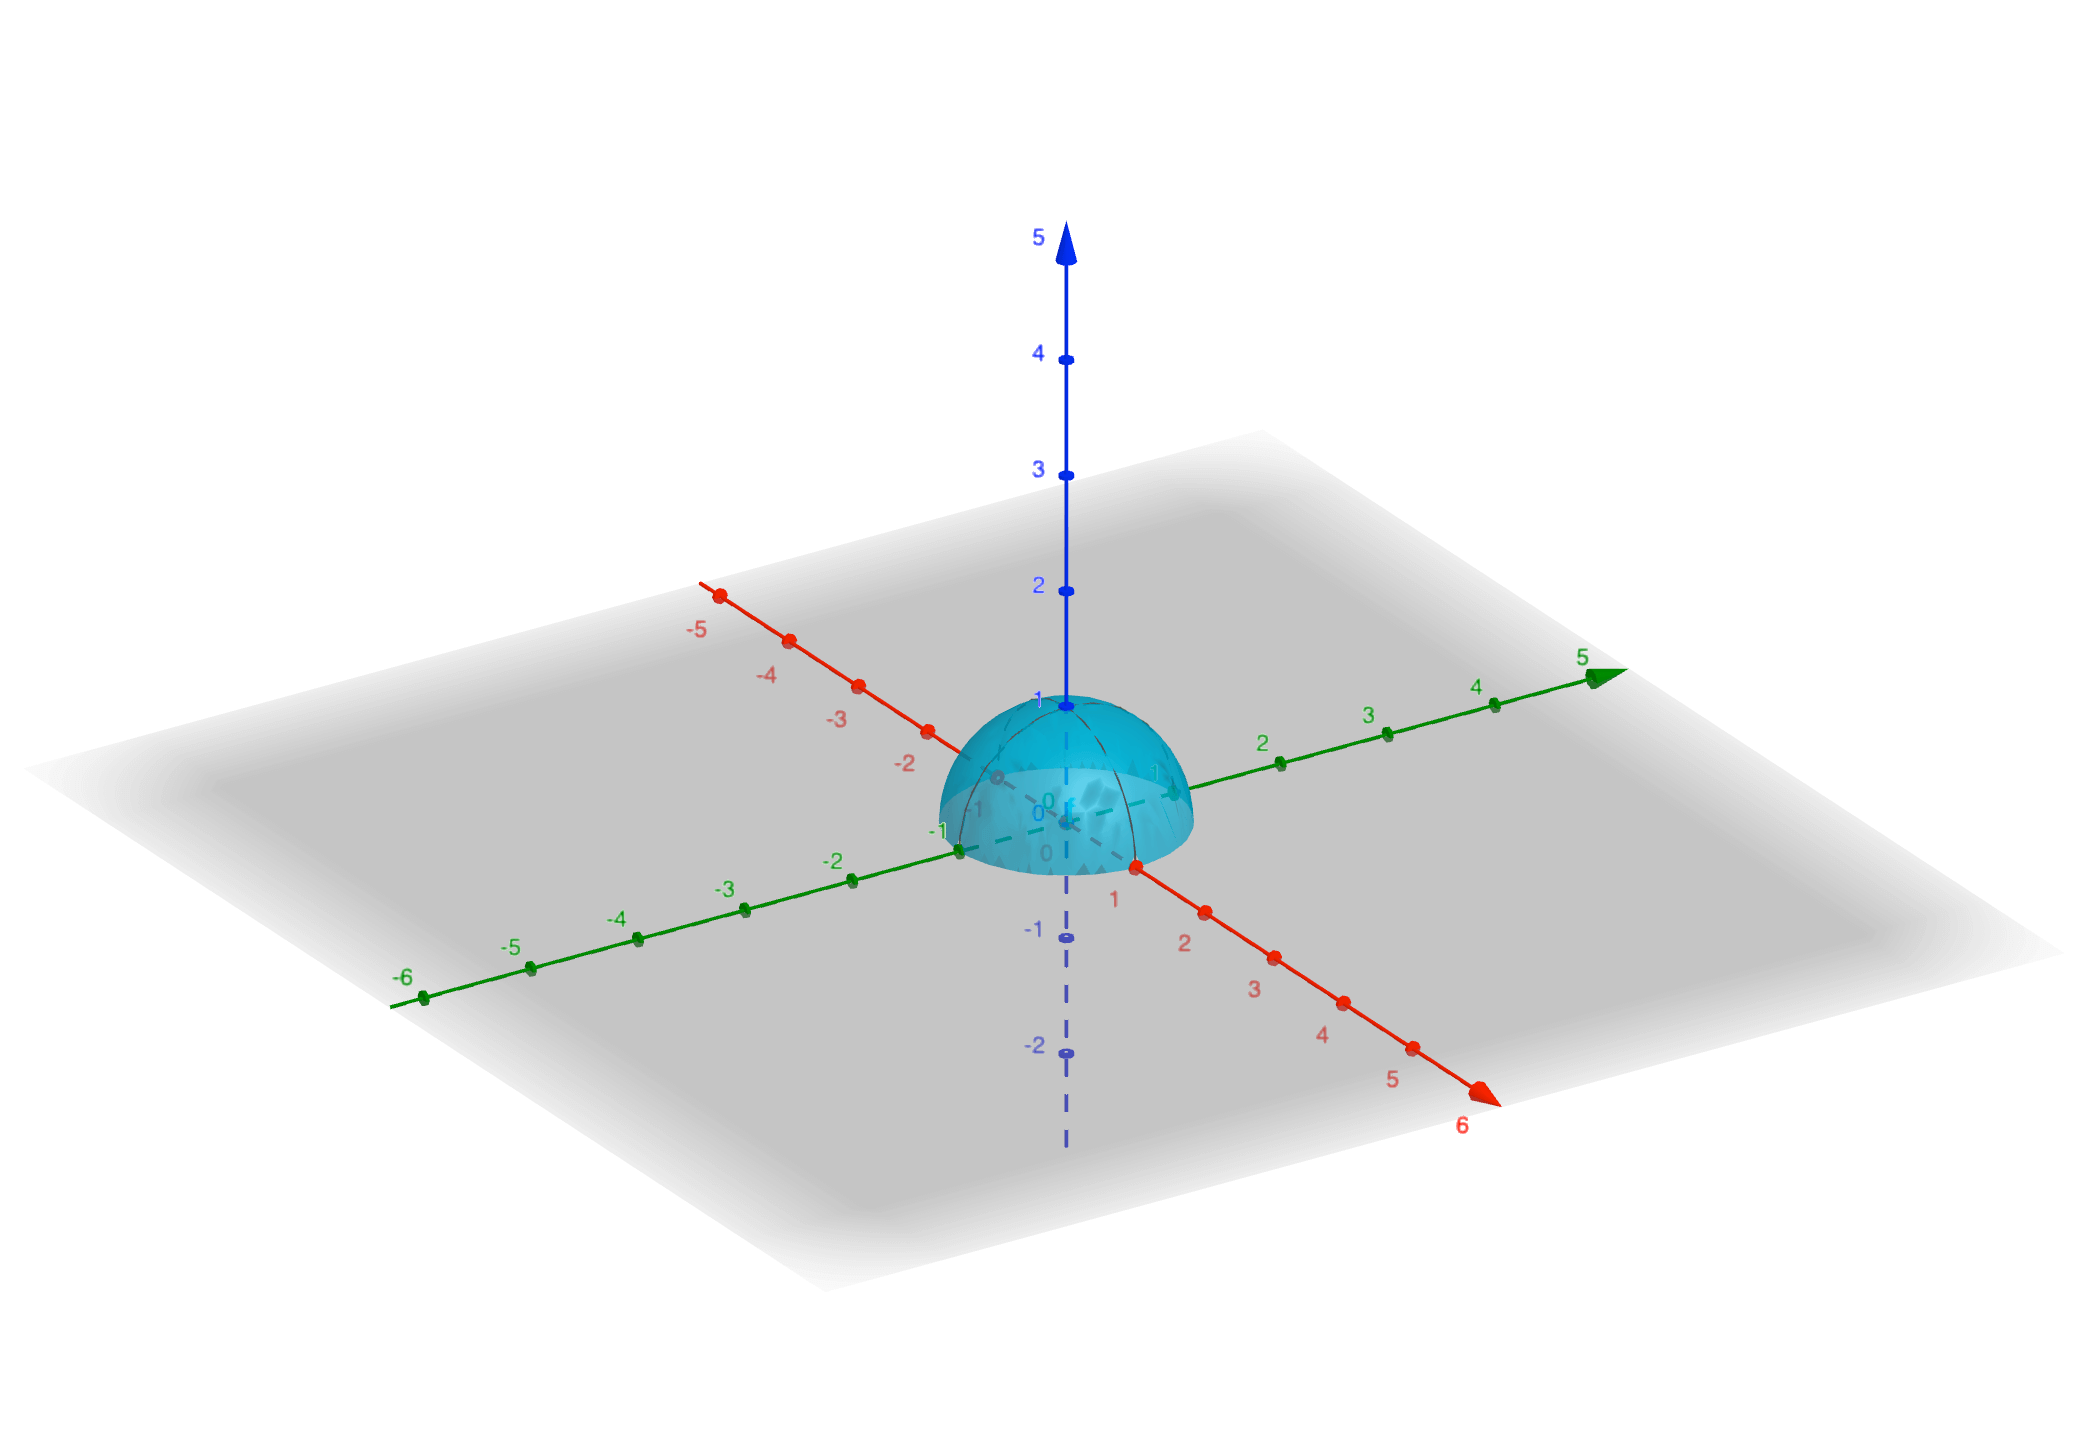
Now we set
We get the same thing setting
Now we draw contours:
And the result is:
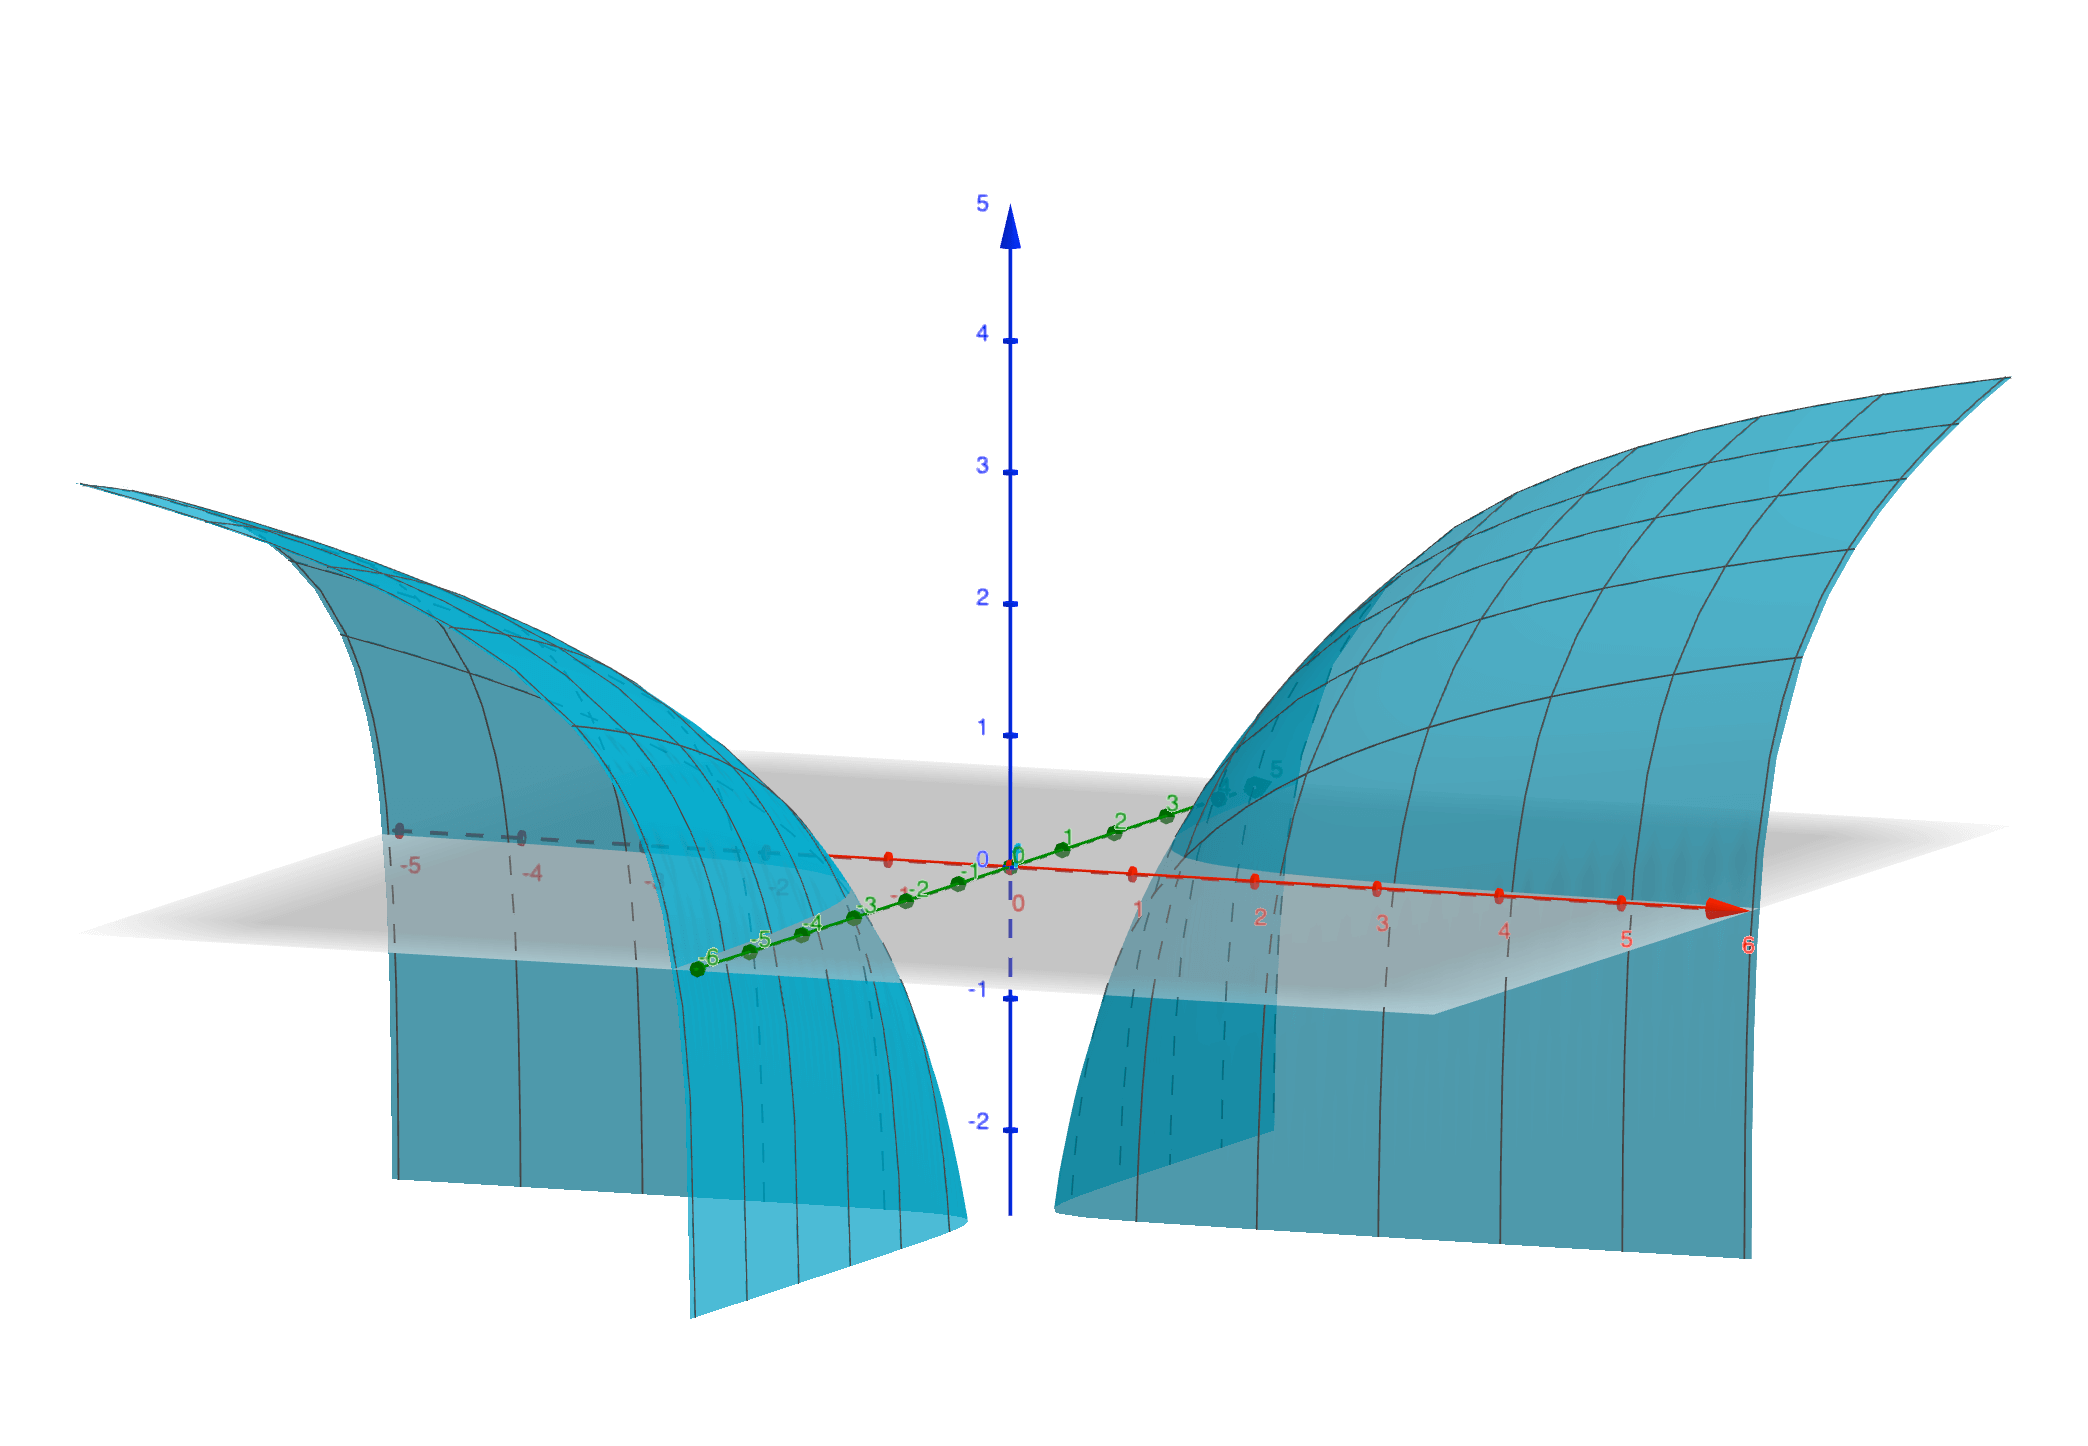
Natural logarithm must take a positive argument, but the product of two negative numbers is also positive, so we can use quadrants 1 and 3. We also cannot include the boundaries.
Domain:
Range:
Since
Slicing at
For contours, we have
Since
As
As